When people ask me, “What’s it like to live with type 1 diabetes?” I show them this picture:
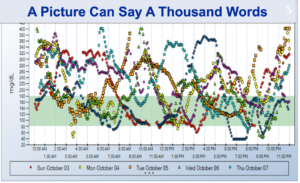
Even with all of the advancements and technology we have today including pumps, CGM, insulin-to-carb correction factor, and everything we do to keep our numbers in range, we still get unexpected drops and elevations, and it’s incredibly frustrating. But one way we can gain better insight into how we’re doing is to look at our CGM downloads. If we don’t look at our downloads, we can easily miss trends in our blood sugars.
Here’s a Picture of a Typical Dexcom Download:
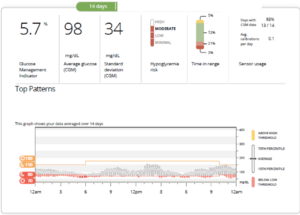
Estimated A1c or Glucose Management Indicator (GMI)
GMI is an estimate of what your A1c would be if you had it done in a lab. However, continuous glucose monitoring gives you your average blood sugar over the past 3 months, which is the most accurate way to measure your average blood sugar. See the video called Why The A1c Sucks and Why Time In Range Is More Important.
Average Glucose Value
In this example the average glucose value is over the last 14 days, but you can download the same information over the past 90 days.
Standard Deviation
Standard deviation is the degree of bounce (highs and lows) you have throughout a period of time. The lower the standard deviation the better, so if you get close to 50 (or below) you’re doing pretty well.
Time In Range (TIR)
TIR means what percent of time you were between 70-180mg/dL throughout the day and night. A good goal to shoot for is 70% or greater.
24-Hour Glucose Profile
You can look at this profile to see what time of day you might be having issues – when you’re having too many highs, too many lows, and very importantly, what time of day your standard deviation is the highest. You can always fix highs and lows if you’re consistently high or consistently low, but if you’re all over the place with no consistent patterns, it’s harder to figure out what’s going on.
Here’s Another Example of a Dexcom Download:
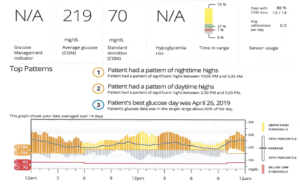
This was most likely a 10 day download, so that’s why A1c isn’t listed. If the Dexcom doesn’t feel it can give you an accurate A1c (less than 2 weeks of data collection), it won’t list one. This person’s average blood sugar is 219. His standard deviation is 70 and his time in range is 27%.
When you look at time in range, you also want to know what makes up the parts that are not in range. Is it mainly highs? Is it mainly lows? Here you can see that 72% of the time, this person had a blood sugar above 180. Remember, the wider these vertical rectangles, the more ups and downs and unpredictable glucose numbers you have, and this person is all over the place.
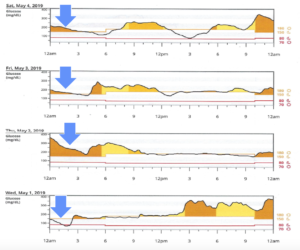
If your download looks like this, the first thing you should do is make sure the basal rate is set correctly. Let’s look at this guy’s mean blood sugar overnight.
If you look at the mean (the black dotted line), it’s possible that he is on too much basal insulin. You need to look at the daily patterns and see if this is a consistent finding. 70% of his total daily dose was basal and only 30% was fast acting, and it’s supposed to be around 50/50. So if your basal/bolus ratio is way off and you see numbers like this, something’s wrong.
Testing Your Basal Rate
Everyone should test their basal rate at least once a year or more whether you are on a multiple daily injection regimen or a pump. How do you do that? Try to have an early dinner and make sure your post-dinner blood sugar is in a desirable range (between 140-180). Try to go to bed with your numbers in that range and with a trend arrow straight across. If you have dinner at 6:00pm and your post-prandial is above 200, you’ll want to give a little correction dose so by the time you go to bed, you’re flat.
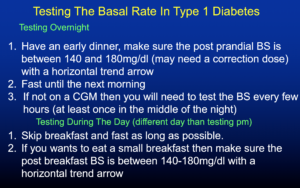
When you wake up the next morning and look at your blood sugar, if your numbers have been creeping up, you may need more basal insulin. If your numbers have been creeping down, you may be on too much. There really should be no more than 30-40mg difference between your bedtime numbers and morning numbers. You may need to test more than once if your differences are slightly too much or you are not flat from dinnertime to bedtime. You can really learn a lot about your basal rate when you do this.
If you’re not on a CGM, you’ll need to test your blood sugar every few hours, or at least once around 3am. Sometimes it’s instructed to test your basal during the day, but it’s much easier to do it at night since you will probably not be eating…unless you walk in your sleep to the fridge like me! If you do it during the day you have to either skip breakfast (or have a very small breakfast) and then fast as long as you can up until dinner. During normal daily activities, you should not be creeping up or down.
How to Use Your Download to Spot and Fix Elevated Glucose Values Overnight
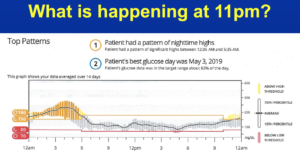
When you look at this person’s 24-hour glucose profile, from 6am through the evening he’s killin’ it, and his standard deviation is tight. So what’s the problem? Well, he has a huge snack every night and he doesn’t bolus for it because he’s afraid of going low during the night. Even though he wears a CGM now, he didn’t wear one for most of his type 1 life and he’s always had this fear. The problem can easily be fixed by bolusing before the snack, or if he doesn’t want to eat the snack he doesn’t have to. I asked him to skip the snack one night and here was his download the next day:
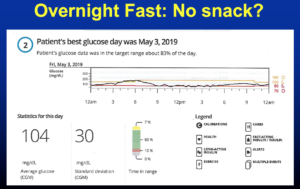
His average blood sugar was 104, his standard deviation was 30, and his time in range was over 80%. His basal at night was beautiful, so we determined that if he covered his snack, he’d do a lot better.
What about Mealtimes? How Do You Prevent Spikes after Eating?
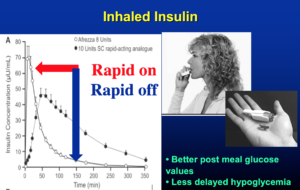
Taking your insulin 20 minutes before eating is a very important technique to prevent the spike. It makes a huge difference, so try to get into the habit of taking your insulin early. The higher the glucose value, the longer you should wait between taking your fast-acting insulin and eating. With inhaled insulin, you should take it at the time of the meal because it acts very fast.
Afrezza is rapid-on, rapid off and I always carry it with me. It’s so nice to correct a high blood sugar and have it come out of your system quickly so you don’t get really low.
Novo Nordisk makes Faster-Acting Aspart or Fiasp. In one study they put it in type 1 pumps and gave them a standardized meal and the blood sugar peak wasn’t as high as with the regular aspart.
How to Use Trend Arrows to Adjust Your Insulin Dose
Trend arrows, which tell you what direction your glucose levels are going, can really help you predict future highs and lows. Trend arrows must be looked at when calculating an insulin dose, planning exercise, during exercise, and many other situations that may affect your glucose control.
Trend Arrows Defined
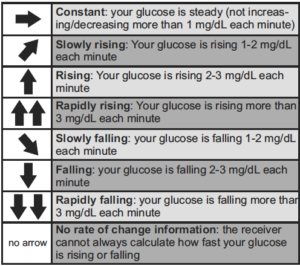
With real-time CGM, alert levels can be individually set for both high and low glucose levels, helping you better detect and manage hyper- and hypoglycemia before they get to extreme levels.
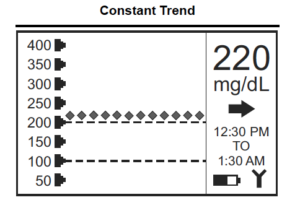
Flat or Horizontal Trend Arrow
In the example below, the glucose value is above the target zone and is flat. After confirming the reading of 220 mg/dL with a fingerstick (not needed with the Dexcom G6 CGM), a constant trend may prompt you to take additional insulin according to your correction factor, or begin exercising.
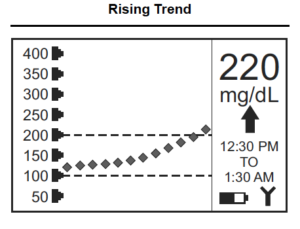
Rising Trend Arrow
In the example below, the glucose value is above the target zone and is continuing to rise. A rising trend may prompt you to take additional insulin over and above what your correction factor calculation would be. If possible, a little exercise would help to bring it down.
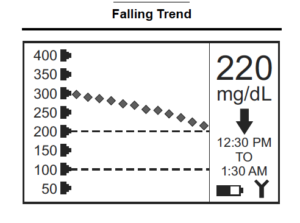
Falling Trend Arrow
In the example below, the glucose value is falling and headed back into the target zone. A falling trend may prompt you to watch and wait. If the trend continues to fall rapidly, even if the glucose reading is still within the target zone, it may prompt you to eat some fast-acting carbohydrates or at least make sure you have some ready if you need it.
Don’t Overreact – Understand “Turnaround Time”
Turnaround time is the time it takes to reverse a trend. Typically, there is a delay between giving insulin and seeing an effect, even with rapid-acting insulin such as Novolog, Apidra, Humalog, Admelog, and Fiasp. Even with Afrezza, there could be a short delay. When your glucose trend is going up, it may still rise for a while before it comes down if you take insulin. When your glucose trend is going down, you may still go down for a while before it comes back up if you take glucose or other carbohydrates. In most cases, it is best to watch and wait before you react to a slowly rising or slowly falling glucose level.
Your CGM Is Your Friend
CGM downloads are incredibly useful to help us see where we might need to make adjustments in our insulin dose and our lifestyle. Knowing your glucose value and what direction it is headed is invaluable. The more you understand how your body reacts to insulin, food and exercise, the better you will do. CGM: weapons of mass instruction!

Hi Very nice discussion – but what about us type 2’s on CGM – I don’t look anything like your profiles. Would love to hear what the difference is between a ‘Lantus” and a ‘Tresibo” . What is the change with Victoza or Januvia? What is ‘normal’ for a Type 2 that is only on basal?
I have been on Libre for a year and still having challenges figuring out eating vs stress vs getting sick.
The target ranges for your CGM should be the same as for people with type 1 diabetes. Everybody’s profile is different, and it depends on many variables including what medications you’re taking.
Tresiba is a longer, flatter basal insulin and certain people do better on it as compared to Lantus, but it just depends on your glucose readings.
Victoza and Januvia come from 2 completely different classes of medications, and once again it depends on your individual needs.
“Normal” blood sugar for someone with type 2 only on basal is shooting for an A1c at least less than 7.5 % and if you are on a CGM, Time in Range of less than 7%.
Great explanation of download info. This will really help me because I’m new to the Clarity program & the charts have been confusing, partly because it’s hard to expand the charts on my phone so I can see all of the markers, words, numbers & details. Tx, Doc. You are great at helping diabetics become more informed so we are better at helping ourselves!!
Thank you Maureen! 🙂